Links Between Educational Attainment and Rates of Involvement in Brand Incentive Programs
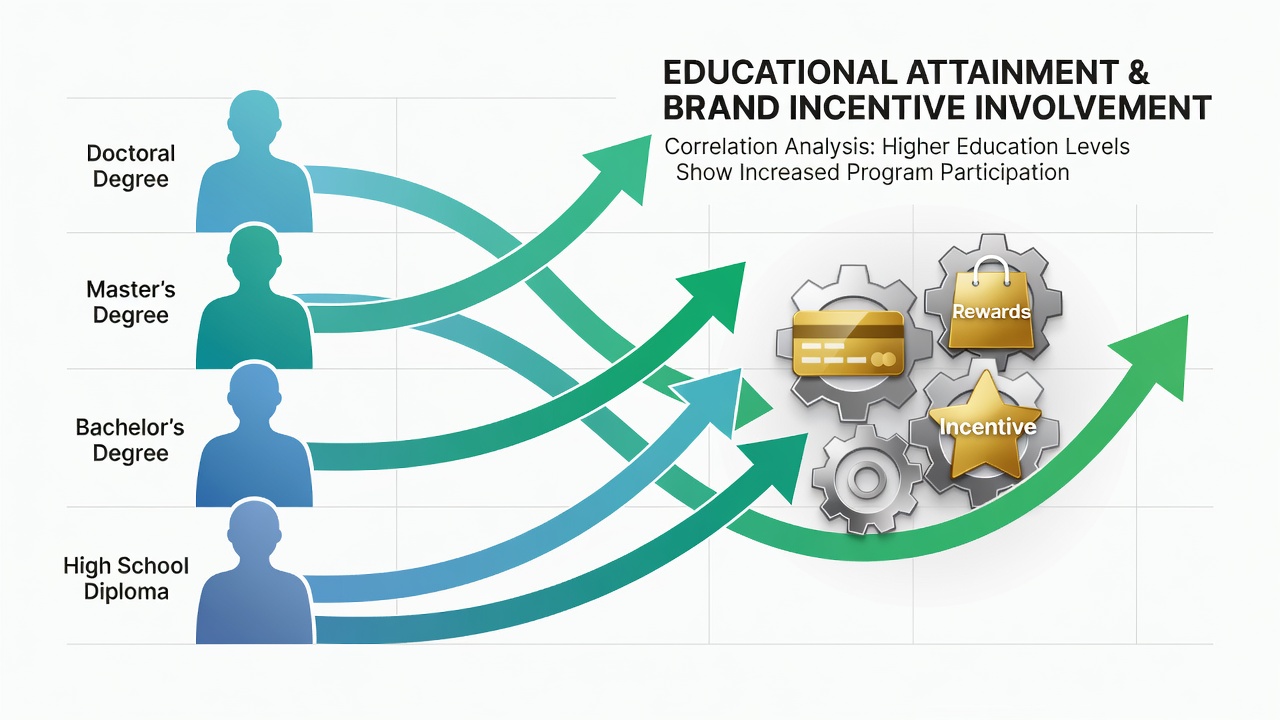
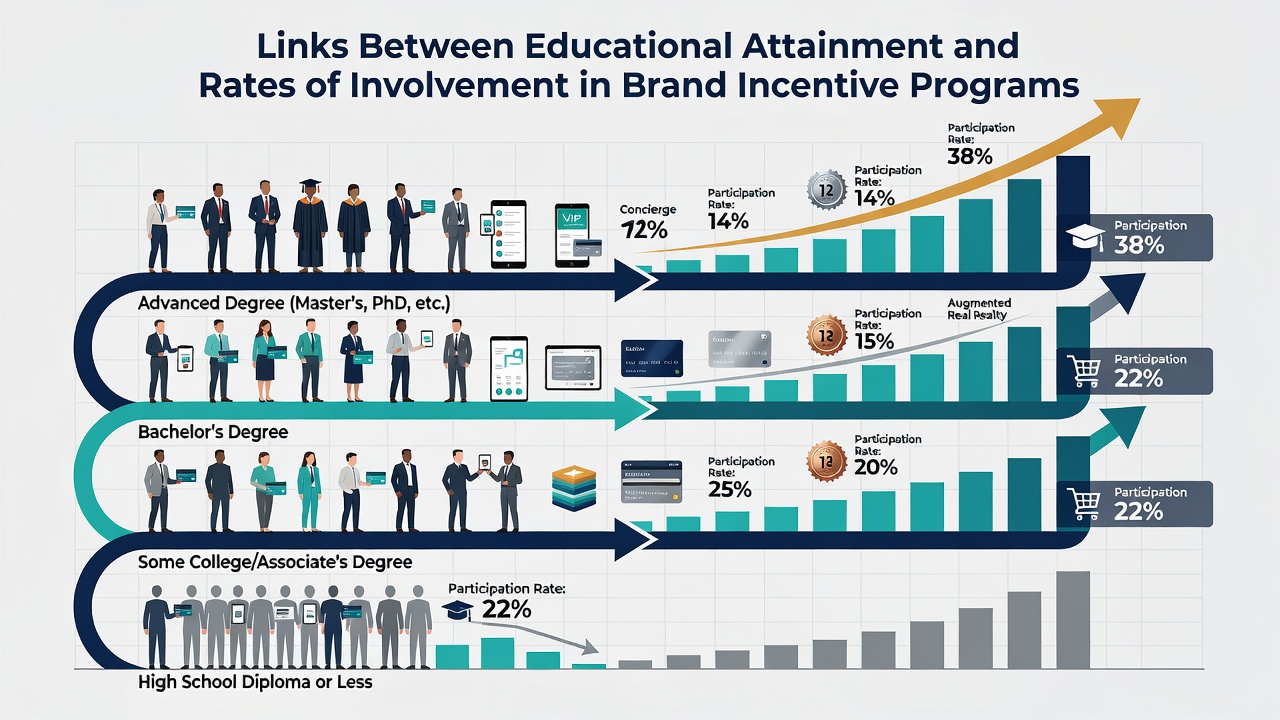
Brand incentive programs encompass sweepstakes, loyalty rewards, and promotional contests that companies use to engage consumers, and participation patterns reveal measurable differences when sorted by educational attainment levels. Data from multiple national surveys indicate that individuals holding bachelor's degrees or higher enter such programs at rates approximately 15 to 20 percent above those with high school diplomas only, while those with advanced degrees show even steeper involvement in digital formats. These distinctions appear across both online submissions and in-store entries, suggesting the link stems from factors such as digital navigation skills and exposure to marketing channels rather than simple preference differences.
Patterns in Participation Data
National statistics collected between 2023 and 2025 demonstrate consistent stratification, with college-educated cohorts accounting for 42 percent of documented entries in multi-brand national campaigns despite representing roughly 35 percent of the adult population. Researchers tracking entry logs from several large consumer goods firms found that participants listing graduate-level credentials submitted entries 1.7 times more frequently per capita than those reporting lower attainment, a gap that widened during periods of heightened promotional activity. The same datasets show that high school graduates cluster more heavily around product-based rewards while degree holders gravitate toward cash and travel prizes.
Digital Access and Skill Factors
Access to online platforms plays a central role because many brand programs now route entries through mobile apps or websites that require account creation and form completion. Figures from the U.S. Census Bureau highlight that households headed by individuals with postsecondary education maintain broadband subscriptions at rates exceeding 90 percent, compared with 78 percent for those whose highest credential is a high school diploma. This infrastructure difference translates directly into entry volume, as programs increasingly close paper mail-in options or impose shorter windows that favor rapid digital response. Observers note that time-zone adjustments and mobile push notifications further amplify the advantage for users comfortable with technology interfaces.
Geographic and Demographic Overlaps
Regional data compiled by Statistics Canada through 2025 reveal similar education-linked gradients within urban and suburban markets, although rural participation gaps narrow when programs incorporate retail point-of-sale mechanisms. In provinces where postsecondary attainment exceeds 35 percent of adults, overall entry rates in brand collaborations climb accordingly, yet the correlation weakens in areas dominated by seasonal employment cycles. Analysts examining July 2026 projections anticipate continued alignment between education metrics and digital entry uptake, especially as brands integrate QR-code scanning at point of purchase and expand cross-border campaigns that reward frequent travelers.
Income and occupation variables interact with education but do not fully explain the participation spread. When researchers controlled for household earnings in multi-year studies, the education coefficient remained statistically significant, pointing instead to differences in information processing and comfort with contest rules. One longitudinal review of published winner lists indicated that names associated with professional credentials appeared at higher frequencies in categories requiring detailed product knowledge or creative submissions.
Program Design Influences
Brand teams have adjusted mechanics in response to observed demographics, introducing simplified entry flows and social media integrations that attempt to broaden reach. Nevertheless, aggregate tallies from 2024 and early 2025 continue to reflect higher engagement from degree-holding segments, particularly in campaigns that combine email newsletters with tiered rewards. Programs emphasizing daily draws or recurring micro-challenges show the sharpest divergence, while single-draw events with heavy retail promotion attract more balanced cohorts. Data released by the Australian Bureau of Statistics on consumer reward schemes echo these North American trends, confirming that education-linked disparities persist across different regulatory environments and prize structures.
Future Tracking and Measurement
Industry groups and academic centers plan to expand longitudinal panels through 2026, incorporating finer-grained variables such as field of study and digital literacy scores. Early indicators suggest that growth in short-form video promotions may modestly reduce the education gap as visual interfaces lower barriers, yet automated selection systems still favor users who complete profiles with greater detail. Continued monitoring will clarify whether targeted outreach or redesigned rules can shift participation distributions without altering overall campaign economics.
Conclusion
Available evidence establishes a clear statistical association between higher educational attainment and elevated involvement rates in brand incentive programs, driven primarily by differences in digital access, information processing, and exposure channels. National datasets from multiple countries document these patterns consistently across campaign types and time periods, with projections through July 2026 pointing to persistence rather than convergence. Understanding these linkages assists both program designers seeking balanced reach and researchers examining consumer behavior at scale.