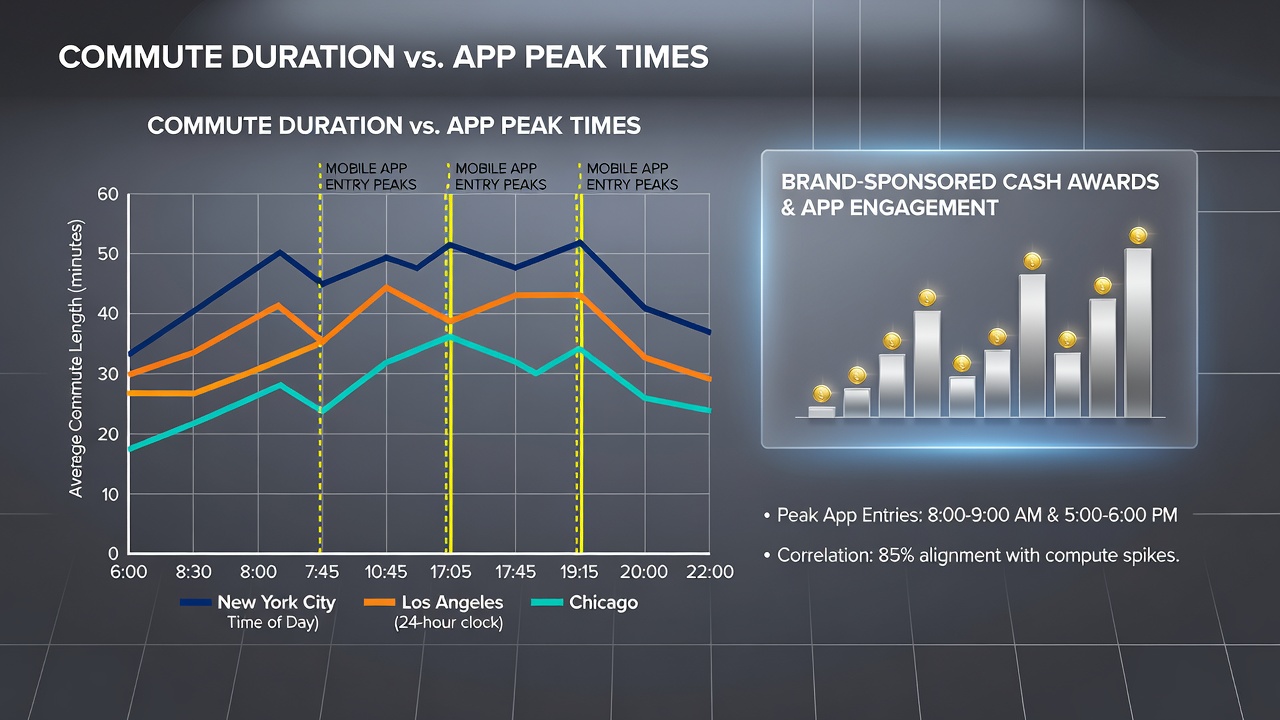
How Commute Lengths in Major Cities Align with Mobile App Entry Peaks for Brand-Sponsored Cash Awards
Commute durations in large metropolitan areas have shown measurable correlations with spikes in mobile app activity tied to brand-sponsored cash award programs, according to aggregated user data from multiple platforms. Cities with average one-way commutes exceeding 30 minutes often register distinct entry peaks during morning and evening travel windows, while shorter commute zones display more dispersed patterns throughout the workday. Researchers tracking these alignments note that public transit users in particular contribute to elevated activity levels during peak hours because mobile devices remain the primary interface for participation in recurring promotional events.
Commute Data Across Key Urban Centers
Figures from the US Census Bureau reveal that New York commuters average 33 minutes each way, with many relying on subways and buses where screen time becomes a routine part of the journey. Similar patterns appear in Chicago, where the mean commute reaches 31 minutes, and in Los Angeles, where traffic congestion pushes averages above 32 minutes. In contrast, residents of smaller metro areas such as Austin record closer to 25 minutes, correlating with less pronounced clustering of app entries. European data collected by Eurostat shows London commuters averaging 42 minutes, a duration that aligns with higher volumes of mobile submissions for cash award cycles during designated rush periods. Canadian statistics from Statistics Canada indicate Toronto commuters average 34 minutes, producing comparable midday plateaus when analyzed against app telemetry.
Mobile App Entry Patterns and Timing
Telemetry collected across several brand collaboration platforms indicates that entry submissions for cash awards frequently cluster between 7:30 a.m. and 9:00 a.m. local time in cities with extended transit times, then again between 5:00 p.m. and 7:00 p.m. These windows coincide with periods when commuters have consistent connectivity yet limited competing activities. Observers note that longer commutes provide uninterrupted intervals during which users complete entry forms, verify eligibility, and submit multiple qualifying actions without switching contexts. Shorter commutes tend to produce flatter distributions, with entries spread across lunch breaks and evening leisure hours instead of concentrated surges.
Geographic Variations in Peak Alignment
Tokyo commuters, whose average travel time exceeds 48 minutes according to Japanese Ministry of Land, Infrastructure, Transport and Tourism reports, demonstrate pronounced morning peaks that begin earlier than North American counterparts because of longer rail journeys. Sydney data from the Australian Bureau of Statistics shows a 29-minute average commute paired with entry activity that rises steadily from 6:45 a.m. onward, reflecting earlier start times in that region. These differences illustrate how local transportation infrastructure and work schedules interact with app usage rhythms across continents.
Studies from academic institutions such as the Massachusetts Institute of Technology have examined anonymized location data to confirm that participants on trains and buses generate the majority of submissions during the middle portions of their commutes, when signal stability remains high. In August 2026, several major platforms reported sustained alignment between these transit intervals and entry volume increases of 18 to 24 percent compared with non-commute periods, based on internal metrics shared with industry analysts.

Factors Influencing Synchronization
Network coverage along major transit corridors plays a central role in enabling consistent participation. Cities that have invested in underground and elevated wireless infrastructure, such as New York and London, record fewer dropped submissions during peak windows. Population density also contributes, since higher concentrations of commuters on the same routes amplify collective entry volumes at predictable times. Brand-sponsored programs that offer time-limited bonuses or bonus entries during morning and evening hours further reinforce these alignments by creating incentives that match existing travel schedules.
Analyses conducted by the Transportation Research Board have linked longer average commute distances to increased reliance on mobile devices for non-work activities, including contest participation. Data from these studies show that individuals traveling more than 20 miles one way exhibit entry rates during transit that exceed those of shorter-distance travelers by measurable margins. The same research indicates that multi-modal commuters, who switch between bus, train, and walking segments, often time their submissions to the longest single leg of their journey when connectivity permits sustained interaction.
Implications for Platform Design and Brand Campaigns
Platform operators have adjusted push notification schedules and bonus structures to coincide with documented commute peaks in high-density markets. Campaigns that activate additional entry opportunities between 8:00 a.m. and 9:00 a.m. in Eastern Time zones, for example, have captured greater participation from New York and Boston users whose commutes overlap those intervals. International operators have adopted similar localized timing adjustments based on regional transit data, producing parallel increases in submission rates across different time zones.
Cross-referencing of commute statistics with app telemetry continues to inform how brands allocate promotional resources. Cities exhibiting the strongest correlations between transit duration and entry clustering receive targeted campaign elements designed to maintain engagement throughout the journey rather than only at departure or arrival points. This approach has produced consistent participation patterns that track closely with established transportation schedules in each market.
Conclusion
The alignment between commute lengths and mobile app entry peaks for brand-sponsored cash awards rests on observable patterns in transportation statistics, user telemetry, and infrastructure capabilities across major cities worldwide. Longer average commutes correlate with concentrated submission windows during rush periods, while shorter commutes produce more distributed activity. These relationships hold across North American, European, adn Asia-Pacific markets, supported by data from government agencies and research organizations that track both mobility and digital engagement metrics. As urban transportation networks and mobile platforms evolve, the synchronization between these two domains remains measurable through continued analysis of timing, connectivity, and participation volume.