Economic Factors Driving Participation Rates in Nationwide Promotional Competitions
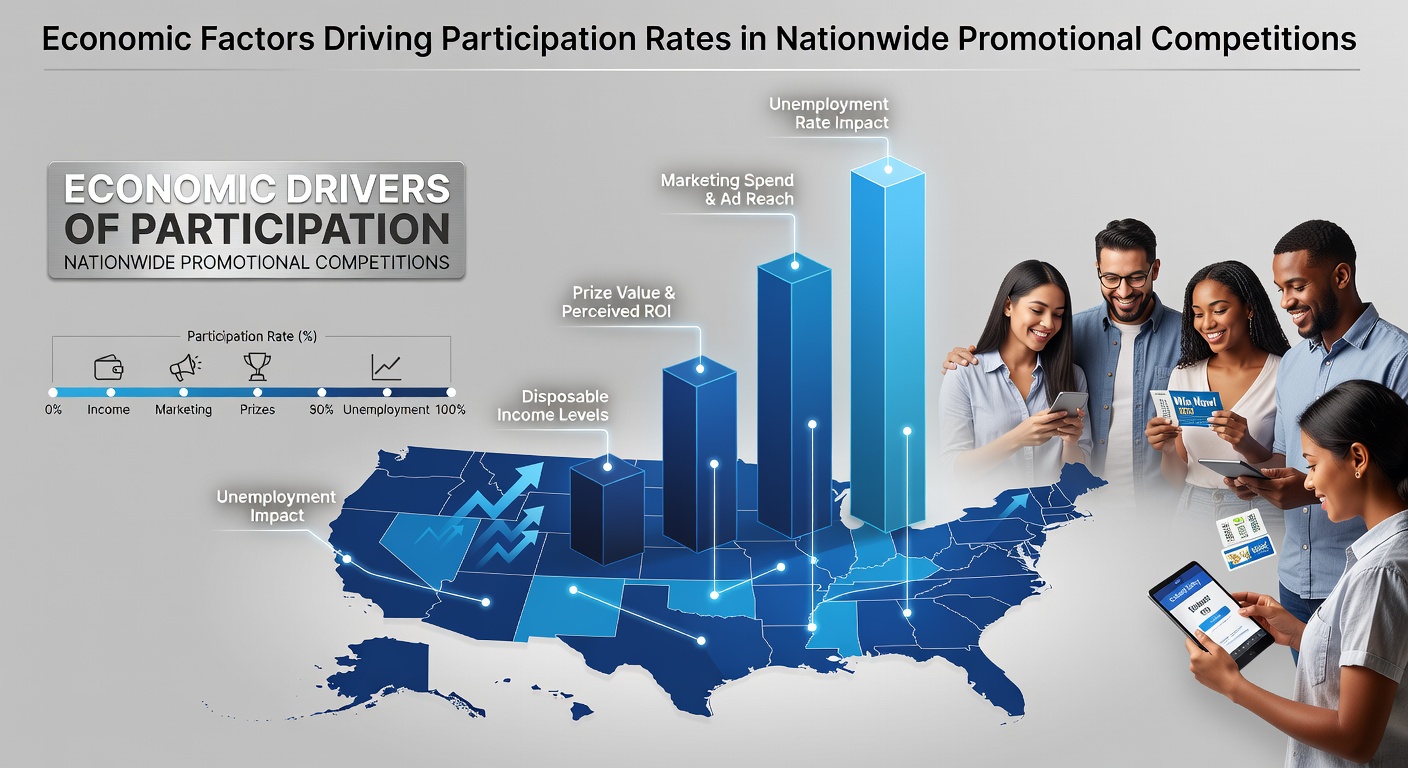
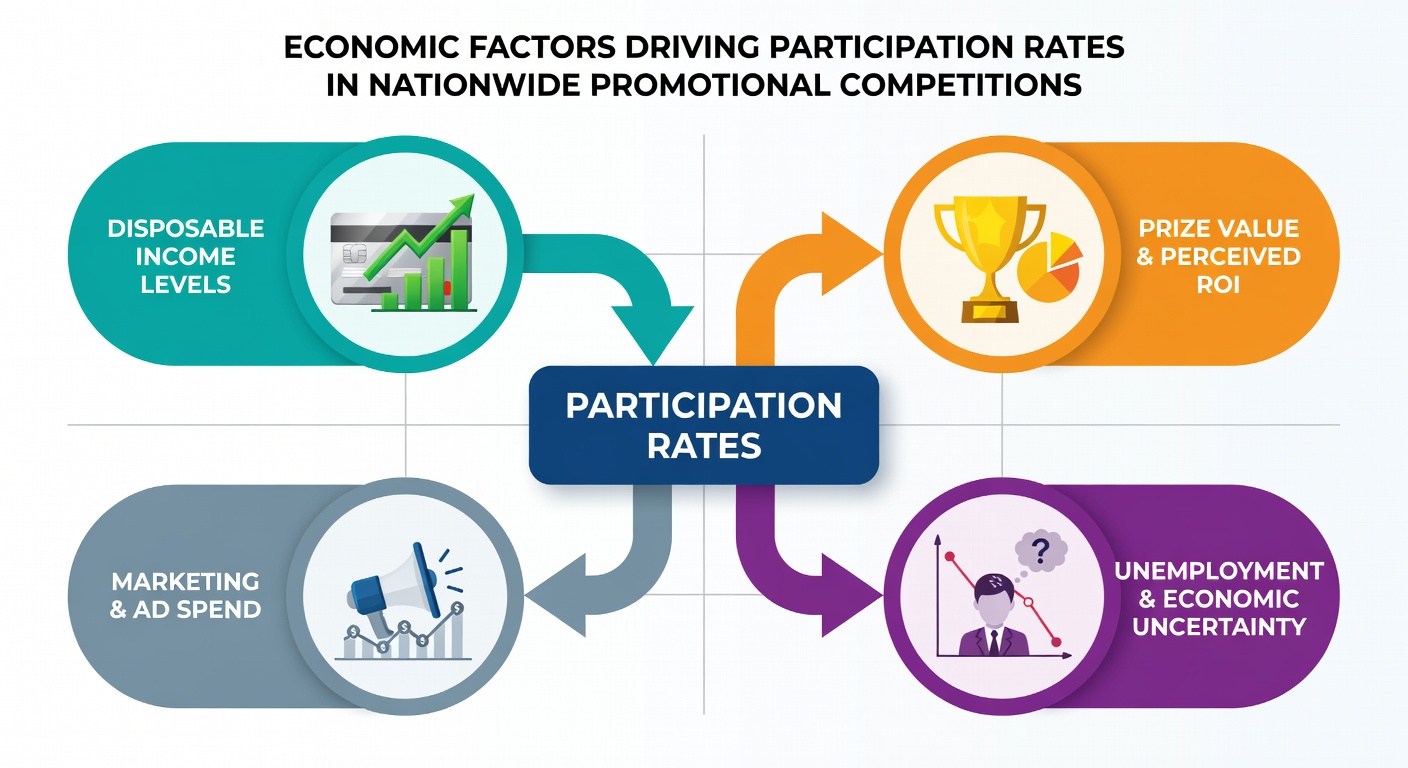
Economic conditions shape how people engage with nationwide promotional competitions and the data reveals clear patterns across multiple regions. Unemployment spikes often coincide with higher entry volumes as individuals seek no-cost opportunities to acquire goods or cash prizes while household budgets tighten. Researchers tracking these trends note that participation tends to rise when job markets soften because the perceived value of free entries increases relative to paid alternatives.
Unemployment Trends and Entry Volume Shifts
Data from labor statistics agencies shows that periods of elevated unemployment correlate with measurable upticks in contest submissions. When job losses mount individuals allocate more time to online entries since the activity requires minimal financial outlay yet offers tangible rewards. Observers tracking entry platforms report that submissions frequently climb within weeks of major layoff announcements as households adjust spending habits and pursue supplemental avenues for products or funds.
In June 2026 employment figures released across several markets highlighted ongoing recovery challenges in certain sectors and entry logs from multi-brand competitions reflected corresponding increases in daily submissions from affected regions. Those analyzing participant demographics find that newly unemployed adults often represent a growing share of entries during such windows because the zero-cost structure aligns with constrained cash flow.
Inflation Pressures and Reward Seeking
Rising prices for everyday items push consumers toward promotional events as a buffer against higher living costs. When inflation erodes purchasing power people redirect attention to competitions offering household staples electronics or travel packages that would otherwise strain budgets. Studies from economic research institutes indicate that inflation-adjusted participation rates demonstrate steady growth during sustained price increases because the potential return from an entry outweighs the negligible effort involved.
Brand collaborations amplify this effect by pooling resources into larger prize pools that attract broader audiences during cost-sensitive periods. Figures from industry reports reveal that giveaway volume expanded in 2025 and early 2026 precisely as consumer price indices climbed in multiple countries prompting more frequent submissions from middle-income groups.
Disposable Income Patterns Across Demographics
Lower disposable income levels directly influence how frequently different population segments enter competitions. Households with reduced discretionary funds after essentials show higher engagement rates because promotional rewards substitute for purchases that might otherwise be deferred. Economists examining longitudinal data note that participation curves flatten among higher-income brackets during stable periods yet steepen across all groups when wage growth lags behind living expenses.
One analysis of entry databases covering 2024 through mid-2026 found that zip codes with median incomes below national averages submitted entries at rates 30 to 40 percent higher than affluent areas during comparable campaign cycles. This pattern holds across both urban and rural settings where economic pressures converge with greater internet access through mobile devices.
Regional Economic Variations and Access
Geographic differences in economic performance produce distinct participation signatures within the same national campaigns. Areas experiencing prolonged manufacturing declines or energy sector volatility generate disproportionate entry shares compared to growth-oriented districts. Government statistical offices such as those publishing through Bureau of Labor Statistics provide granular unemployment maps that align closely with submission heat maps from major contest operators.
European data compiled by Eurostat similarly demonstrates that member states facing slower GDP expansion recorded elevated activity in cross-border promotional draws during the first half of 2026. These variations underscore how localized economic signals translate into measurable behavioral shifts without requiring changes in contest rules or marketing intensity.
Broader Macroeconomic Indicators
Interest rate environments and consumer confidence indices further modulate entry flows. When borrowing costs rise households delay big-ticket acquisitions and turn instead to promotional channels for similar items. Academic reviews of consumer behavior datasets confirm that confidence dips precede measurable participation surges by roughly one to two quarters allowing analysts to anticipate volume changes based on leading economic signals.
Supply chain disruptions that elevate product scarcity also heighten interest in competitions because limited retail availability increases the relative appeal of prize acquisitions. Observers monitoring both macroeconomic releases and contest analytics note these converging factors produced sustained entry growth through spring 2026 before stabilizing as certain inflation metrics eased.
Conclusion
Economic variables including unemployment inflation income distribution and regional performance collectively determine participation trajectories in nationwide promotional competitions. The patterns documented through labor statistics consumer surveys and platform analytics demonstrate consistent linkages that persist across different market cycles and geographic contexts. These relationships allow stakeholders to interpret entry data as an indirect reflection of broader financial conditions affecting households at any given time.